A complete, concise Archive account. Free to read in full.
Coral Sea, between Australia and New Caledonia · Reported in 1876; investigated in 2012
On one map, there was an island. On the chart used to navigate the ship, there was open sea.
In October 2012, scientists aboard the research vessel Southern Surveyor were working in the Coral Sea, between Australia and New Caledonia. Among the geographical data available to them was an elongated patch of land called Sandy Island, roughly twenty-five kilometres long.
It appeared in digital maps and scientific datasets. Yet the ship’s navigation chart gave the area to the sea.
The discrepancy was large enough to investigate. As the vessel approached, there was no coastline on the horizon. The echo sounder continued to register deep water.
The island had survived generations of mapmaking. The question was how it had reached the map in the first place. [1]
A Name Beside an Outline
One surviving clue lay on a chart published in 1908.
Beside the supposed island was a reference to the Velocity and the year 1876. A report from a nineteenth-century vessel had acquired a position, a name and an outline. Long afterwards, those marks were still being reproduced.
Following the 2012 voyage, Auckland Museum researcher Shaun Higgins found the entry while examining the museum’s charts. The chart also carried a general caution about the waters it described: its information had been assembled from voyages made over many years, and the positions of hazards were not necessarily exact.
That warning belonged to the practical world of navigation. An uncertain report could matter to the next ship passing through. Leaving a possible danger on a chart might be safer than removing it without adequate investigation.
But uncertainty is easily lost when information changes hands. The caution could remain in small print while the island’s outline travelled onwards. [1, 2]
The Island Already in Doubt
Sandy Island had not been accepted without reservation by every chartmaker.
Some charts marked it with the abbreviation “ED”: existence doubtful. Other records contained soundings inconsistent with land at the reported position. The later scientific account identified historical depths ranging from 1,488 to 2,353 metres.
French hydrographic authorities removed the island from their charts in 1974. Australian charts followed in 1985.
By the time the Southern Surveyor arrived, the island had therefore been absent from important navigational charts for decades. Its continuing presence elsewhere was a problem of records which had diverged.
There was another complication. Sandy Island is an ordinary descriptive name, and other islands bear it. A name alone could not establish that two historical references concerned the same place. The position, chart and source of each entry mattered. [1]
The Soundings Beneath the Ship
The research vessel’s route passed approximately five kilometres south of the island’s supposed position. It did not sail through the centre of the mapped outline.
Along the surveyed route, the shallowest water was still around 1,300 metres deep. No island was visible. The observations agreed with the navigational chart and with the earlier soundings.
There was no newly exposed reef, no wreckage of a coastline, no sign that a substantial island had recently slipped beneath the surface.
What the voyage encountered was a disagreement between a map and the sea. Its measurements helped make that disagreement impossible to overlook. [1]
The Evidential Divide
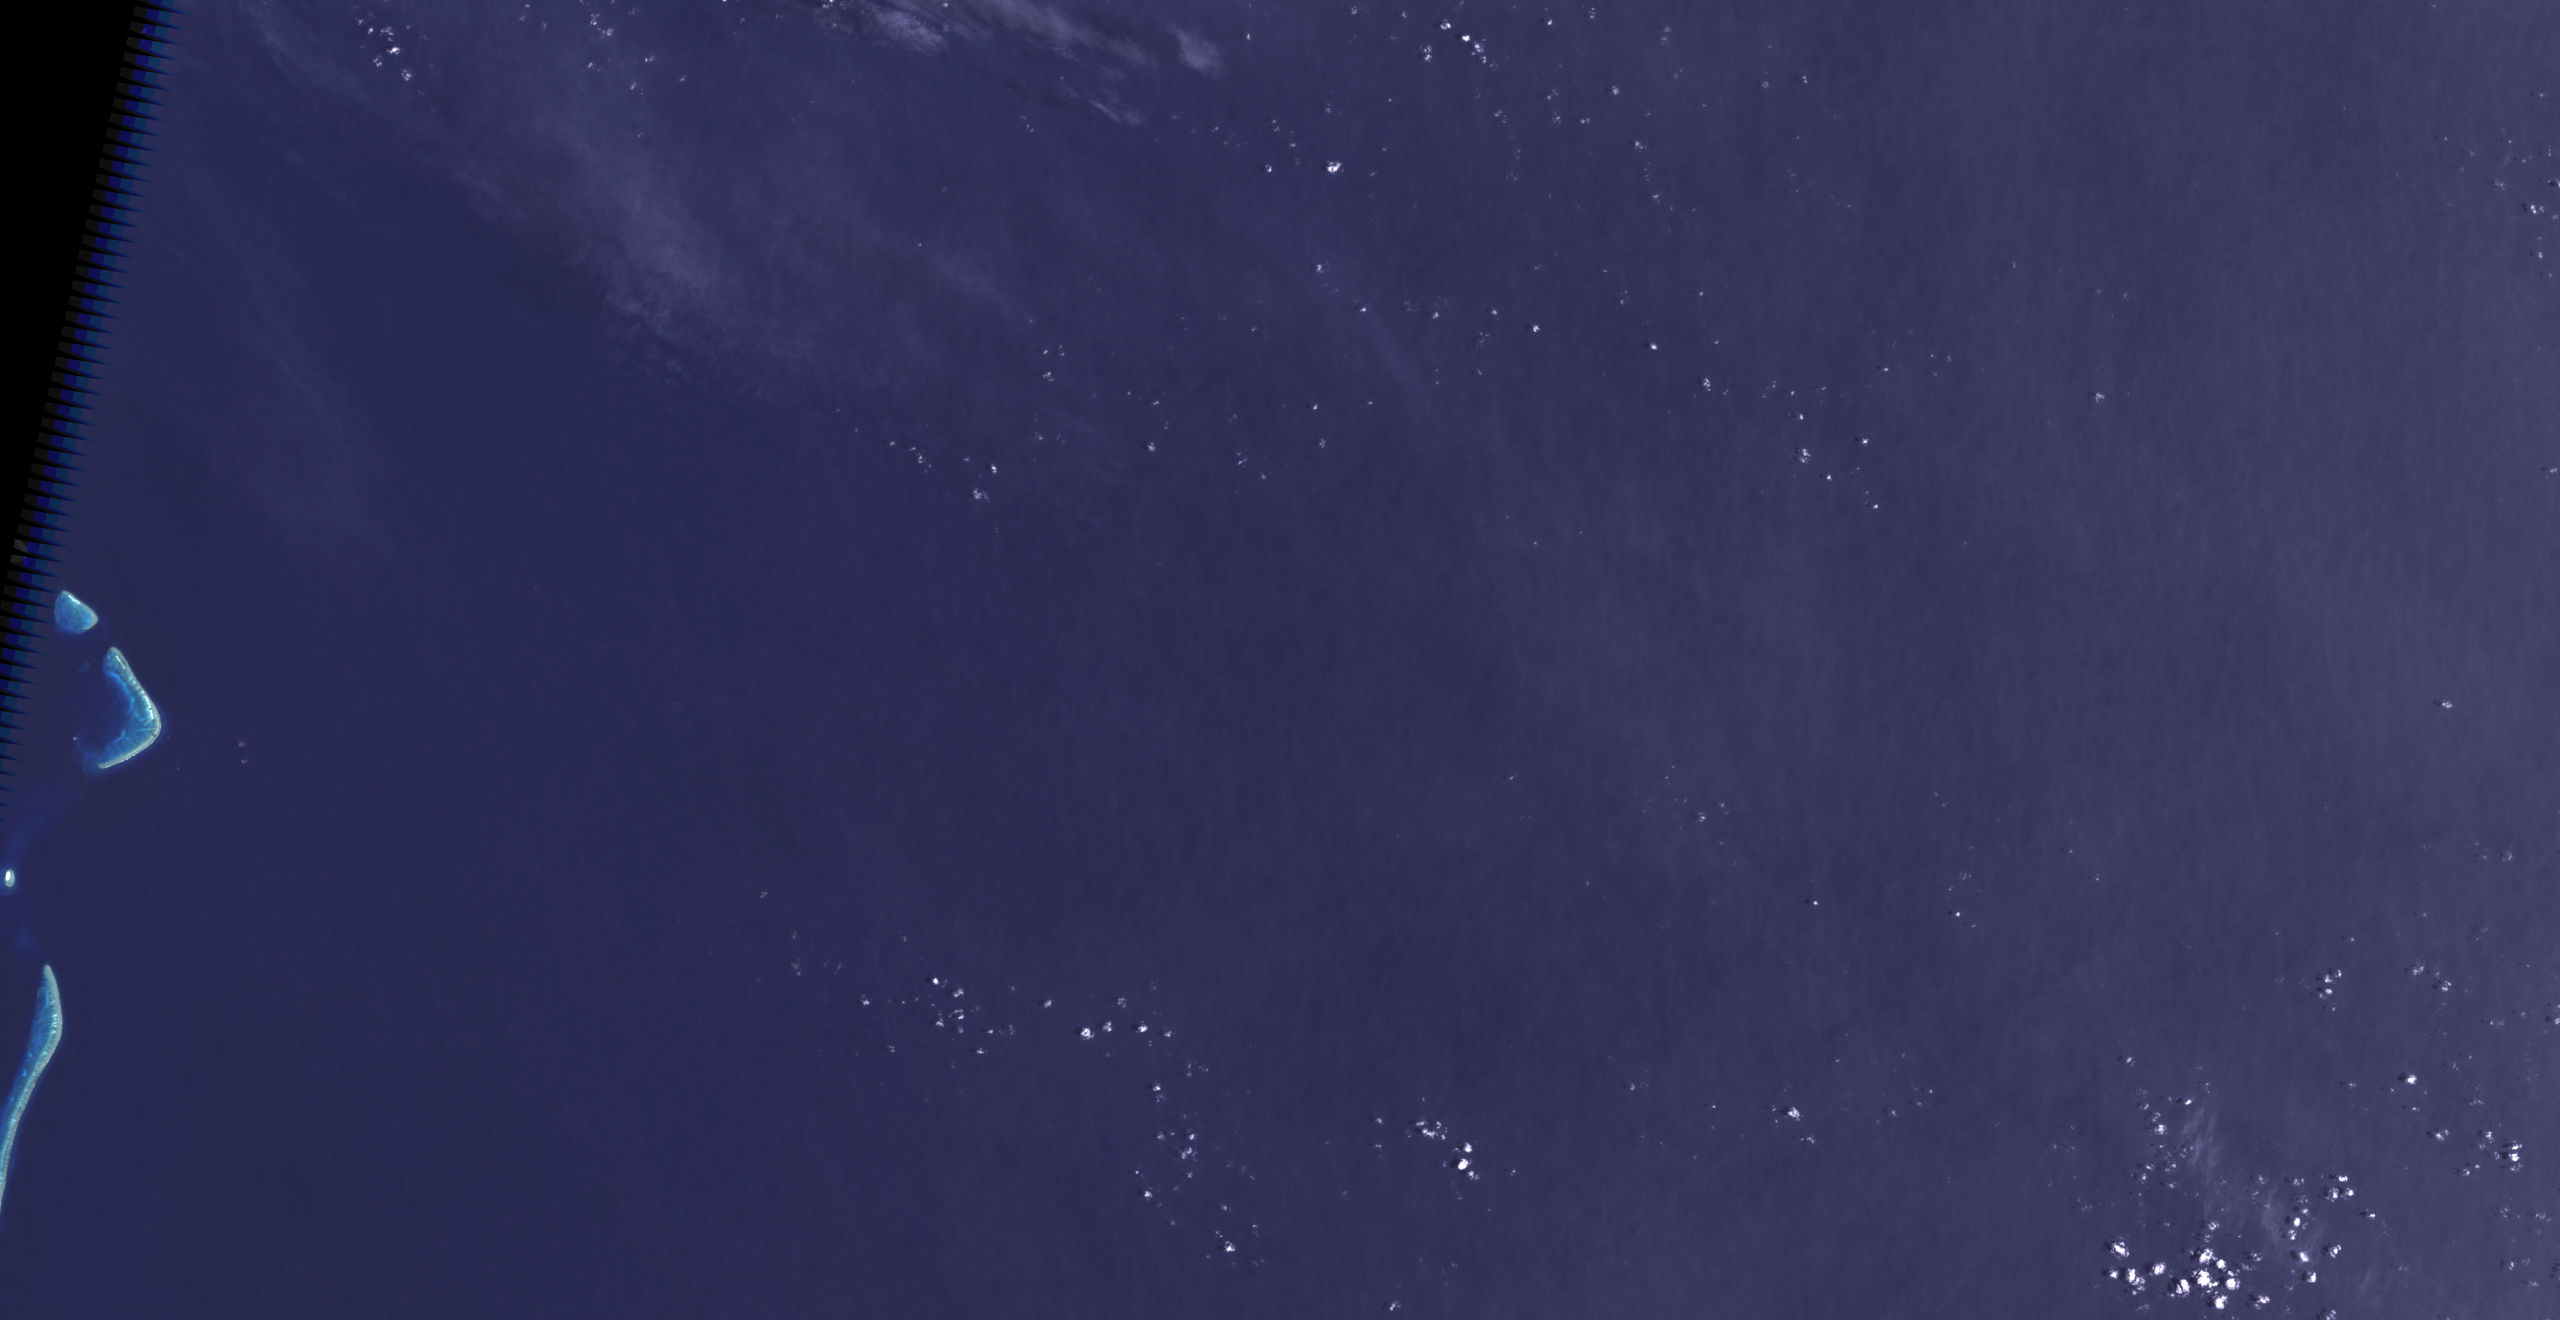
What was established: Sandy Island appeared in widely used geographical datasets, while navigation charts, historical soundings, satellite imagery and the 2012 observations supported open water.
What remained uncertain: precisely what the Velocity reported in 1876, and how that observation became the island outline inherited by later maps.
How the Outline Travelled
The digital age had given the old island a new means of survival.
Its outline entered a widely used coastline dataset, the World Vector Shoreline. Later products inherited that geography. Where their calculations required a distinction between land and sea, Sandy Island was treated as land.
Some elevation datasets consequently assigned it a small height above sea level. Several apparently separate sources could now seem to confirm one another, although they shared the same underlying error.
The outline’s appearance on a screen did not mean that a satellite had photographed an island. A digital map can combine imagery, coastlines, labels and elevation data assembled at different times and for different purposes.
In this case, an inherited boundary had outlasted the observations which should have displaced it. [1]
Read the Record: The Warning on the 1908 Chart
The chart examined by Auckland Museum included a general warning about navigating among the low islands of the Pacific. Its details had been gathered from numerous voyages over a long period, and the relative positions of hazards might be inaccurate.
This was a caution about the chart as a whole, rather than a specific explanation of Sandy Island. Alongside the reference to the Velocity, however, it preserves something later digital outlines could conceal: the information had a history, and its compilers knew that parts of it were uncertain.
Source: Shaun Higgins, Auckland Museum, “The mystery of an island that isn’t there,” 2012. The historical chart is discussed here but is not reproduced.
A Surface Made of Floating Stone
One possible explanation begins with something that can resemble land without being fixed to the seabed.
When a submarine volcano produces enough pumice, the lightweight rock can gather into a floating raft. Such rafts may cover large areas and travel considerable distances with winds and currents.
Could a nineteenth-century observer have encountered one, and left behind a report which later became an island?
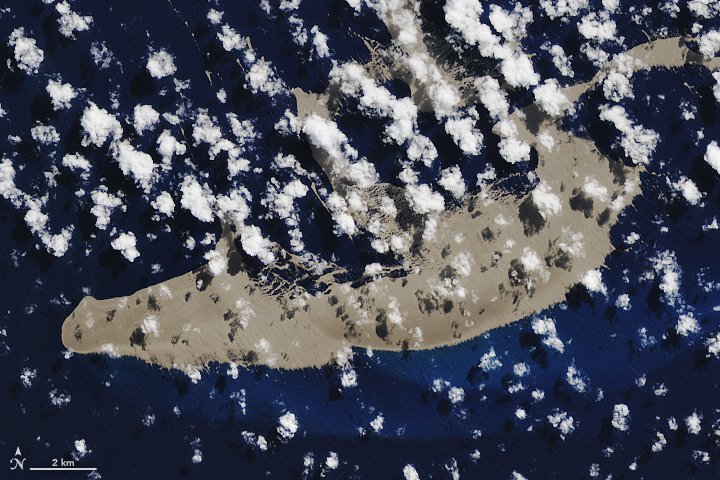
The researchers who examined Sandy Island considered the possibility. Modern observations showed that pumice originating near Tonga could travel towards this part of the Coral Sea. That made the suggestion physically plausible.
It did not make it a historical identification. No evidence examined in the study tied a particular pumice raft to the Velocity’s report.
A mistaken position, a misunderstood observation or an error introduced during chart compilation could also have contributed. The surviving map entry does not preserve enough detail to choose confidently between them.
The more dramatic possibility—that a substantial island had vanished beneath the sea—found no support in the evidence assembled for the investigation. The mystery lay further back, in the passage from something reported to something drawn. [1]
Archive Assessment
Sandy Island was a phantom island with a real documentary history.
The modern claim can be settled: the elongated landmass shown in those datasets was not present at the stated position. Its survival on digital maps did not outweigh the hydrographic record. Instead, it revealed how widely an old entry could circulate after other authorities had already rejected it.
The earliest observation is less easily recovered. Pumice offers an intriguing possibility, but the evidence does not establish what the crew of the Velocity saw, how accurately it was positioned, or what happened to the description as it passed into later charts.
The modern ship could measure the water. It could not retrieve that earlier horizon.
Archive Classification
Debunked
The claim that a substantial island occupied the mapped position is contradicted by the available observations and hydrographic evidence. The origin of the nineteenth-century report remains uncertain; a drifting pumice raft is a possible explanation, not a demonstrated one.
Key Facts
- Location: Coral Sea, between Australia and New Caledonia.
- Historical reference: The vessel Velocity, 1876, cited on a later chart.
- Mapped dimensions: Approximately 25 kilometres long and 5 kilometres wide.
- Earlier corrections: Removed from French hydrographic charts in 1974 and Australian charts in 1985.
- Modern investigation: The research vessel Southern Surveyor, 2012.
- Survey detail: The ship’s route passed approximately five kilometres south of the supposed island; the shallowest measured water along that route was around 1,300 metres.
- Unresolved point: The observation or error behind the original report.
Continue Through the Archive
At Nan Madol, the structures are unmistakably present: walls and artificial islets rising from the waters of the western Pacific. The questions concern the people who built them, the work involved and the traditions which gathered around the ruins.
Explore Nan Madol: The Lost City Built on the Sea →
Sources
- Maria Seton, Simon Williams, Sabin Zahirovic and Steven Micklethwaite — “Obituary: Sandy Island (1876–2012).” Eos, Transactions American Geophysical Union, volume 94, issue 15, 2013, pp. 141–142. DOI: 10.1002/2013EO150001. The research team’s account of the voyage, chart history, digital datasets and possible pumice explanation.
- Shaun Higgins — “The mystery of an island that isn’t there.” Auckland Museum, 2012. Examination of the museum’s 1908 chart, its reference to the Velocity and its general navigational caution.
- NASA/USGS — Landsat 7 ETM+ imagery acquired on 10 January 2002. Processed regional image available through Wikimedia Commons as “Sandy Island (Alleged Location) 2002-01-10, Landsat 7 ETM+.”
Further Reading
The research team’s published account follows the island through historical charts and digital coastline datasets. The paper is available through the authors’ EarthByte research group: “Obituary: Sandy Island (1876–2012)” · PDF.
NASA Earth Observatory — “A Raft of Rock” describes the separate 2019 pumice event illustrated above. It shows how a volcanic eruption can produce a substantial floating surface, without establishing that this explains Sandy Island’s nineteenth-century origin. Read NASA’s account.
Image Credits
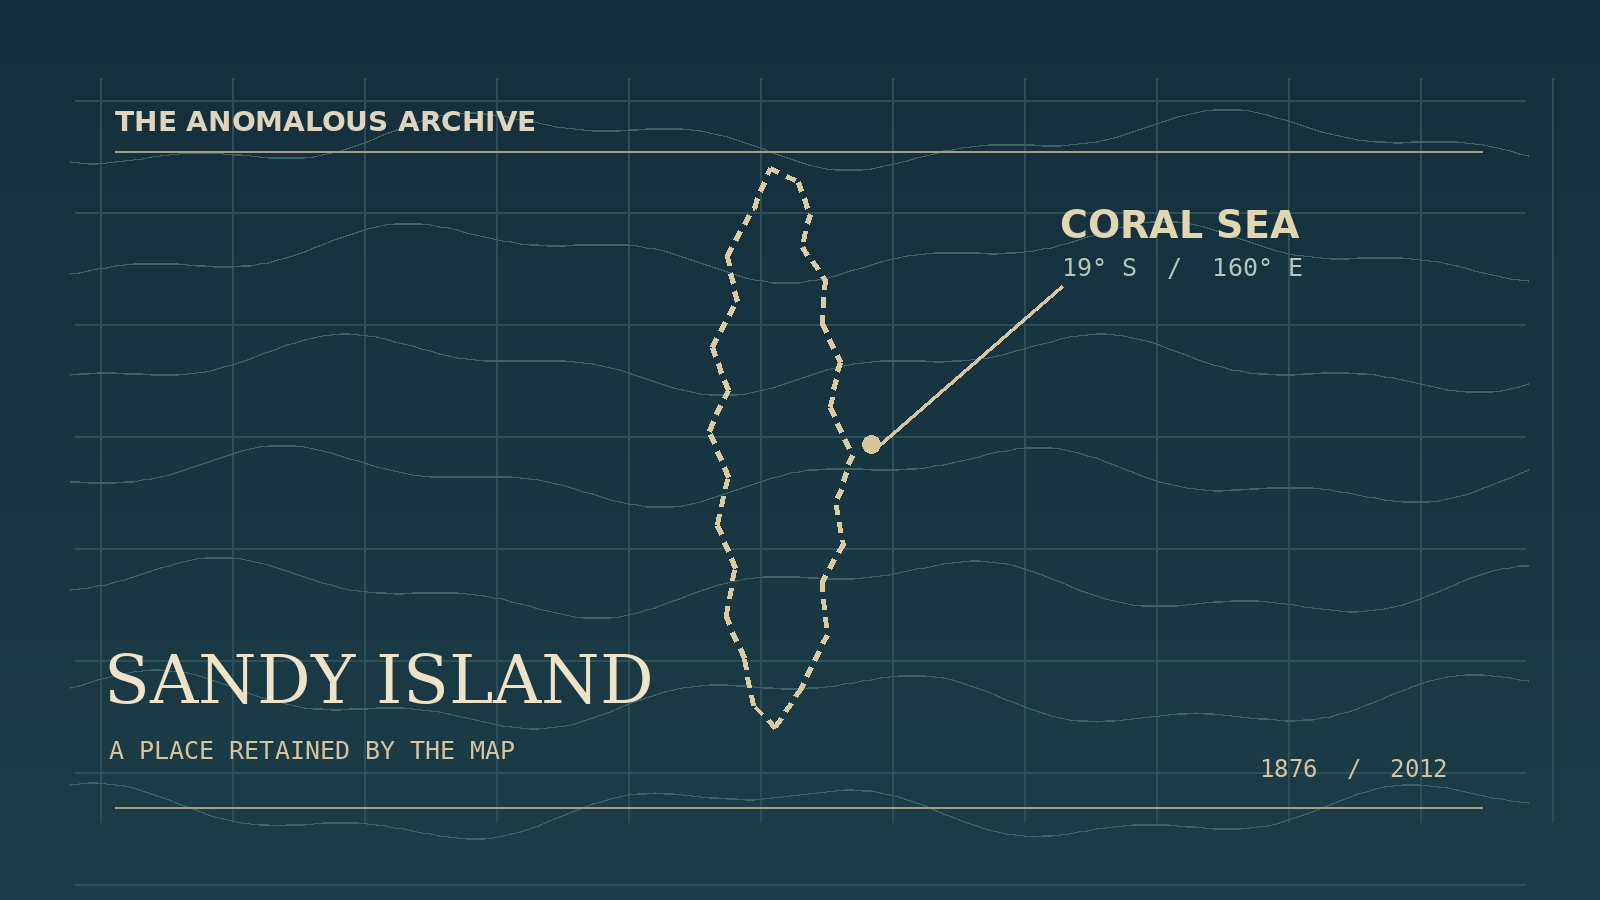
Header: original illustration created for The Anomalous Archive. A schematic interpretation, not a navigational chart, historical document or exact ship-track reconstruction.
Sandy Island regional satellite image: NASA/USGS Landsat 7 ETM+ data, acquired 10 January 2002. Image processing by Wikimedia Commons contributor Разрывные. Source and public-domain information. Resized for web presentation.

Tonga pumice raft: NASA Earth Observatory image by Joshua Stevens, using Landsat data from the U.S. Geological Survey. Acquired 13 August 2019 and published with “A Raft of Rock”. Used in accordance with NASA’s image-use guidance. Resized for web presentation. The photograph illustrates a separate event and does not depict Sandy Island.
Editorial note: the 2012 ship track passed south of the alleged island rather than through its centre. Pumice is presented as a proposed explanation for the historical report, not an established finding. The 1908 chart is discussed but not reproduced.