The Nine-Day Signal: What Shook the Earth in 2023?
Dickson Fjord, eastern Greenland, Arctic North Atlantic · September–October 2023
Complete and free to read
Key Facts
- First detection: 16 September 2023.
- Signal: A remarkably regular vibration, repeating approximately every 92 seconds.
- Duration: Detectable for nine days.
- Reach: Recorded by seismic instruments around the world.
- Central question: What could keep producing the same slow rhythm for more than a week?
The signal was faint. Its persistence was the problem.
On 16 September 2023, seismic instruments began recording a slow, remarkably regular vibration. Roughly every minute and a half, the pattern repeated.
An earthquake usually leaves a complicated mixture of frequencies. This was much closer to a single note—a hum too low for human ears.
Hours passed. The signal remained. Stations separated by thousands of kilometres were recording the same unfamiliar rhythm.
Researchers gave it a provisional name: USO—Unidentified Seismic Object.
It appeared to come from eastern Greenland. Whatever was producing it had not finished. [1, 3]
A Mountain Missing
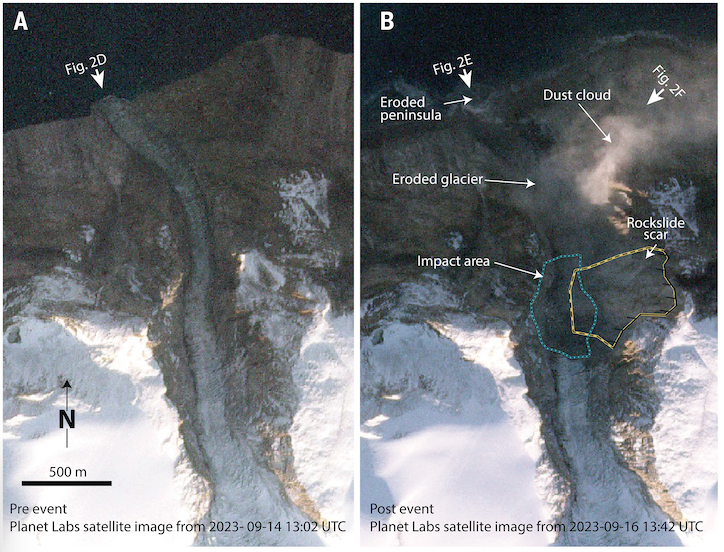
At Dickson Fjord, part of a mountain had fallen into the water.
About 25 million cubic metres of rock and ice descended from the slope. Near the impact, the tsunami reached roughly 200 metres above sea level. Farther through the fjord system, much smaller waves damaged an unoccupied research station on Ella Ø, around 70 kilometres away.
The photographs left little doubt about the violence of the collapse. A mountain peak and glacier had occupied the view. Now there was a vast scar.
That explained the first disturbance. A falling mountain could shake the ground, and water displaced by it could devastate a shoreline.
But the instruments were still registering their slow rhythm days later.
The collapse was over. Something else was continuing. [1, 3]
The Explanations That Did Not Settle It
The investigation brought together researchers working on earthquakes, glaciers, landslides and waves. The international team behind the eventual Science paper numbered 68.
In interviews about the search, researchers described possibilities ranging from vibrating ice to hidden volcanic activity. Perhaps water moving within a glacier was producing a resonance. None supplied a convincing account of the persistent signal.
There was room for humour, too. Speaking to Quanta Magazine, seismologist Stephen Hicks joked:
“If we found no other explanation, we would have gone for sea monster or baby dragons.”
The monsters belonged to the conversation’s lighter moments. The serious difficulty remained the same: finding something that could repeat a movement for nine days while slowly losing energy. [3, 6]
The Fjord That Seemed Quiet
Three days after the collapse, a Danish military vessel visited the fjord. The team could document the changed landscape, but did not observe the oscillation later identified as the source of the global signal.
At distant seismic stations, it was still there. [4]
There was another complication. An instrument already measuring water levels in the fjord transmitted readings at 15-minute intervals. The suspected movement completed a cycle in about 90 seconds. Its rhythm could slip between those widely spaced observations.
The instrument also stood away from the part of the fjord where modelling placed the strongest oscillation. Being close to an event did not necessarily mean having the right record of it. [1]
The Water Left Behind
One explanation survived the discussion. After the initial tsunami, perhaps the water had continued rocking across the fjord.
Such an oscillation is called a seiche. Water rises towards one side of a basin, returns, and rises towards the other. Here, the basin was a deep Arctic inlet bounded by steep rock walls.
With each movement, the shifting water exerted a force on the surrounding ground. A relatively small stretch of sea could therefore generate seismic waves detectable far beyond Greenland.
The difficulty was duration. Why had the movement not quickly died away?
The Geological Survey of Denmark and Greenland records that one researcher even tried reproducing the effect in a bathtub. The attempt failed. The fjord’s particular shape mattered.
Computer models incorporated its depth, narrow channel and bends. They produced an oscillation that lost energy unusually slowly, with a period close to the one in the seismic recordings.
The fit was not exact, but the different lines of evidence converged. In September 2024, the team published its explanation: the mountain had started the disturbance; trapped, oscillating water had sustained it. [1, 3]
The Initial Wave and the Long Aftermath
The approximately 200-metre figure describes the extreme local reach of the initial tsunami near the collapse. The persistent seiche was much smaller and diminished over time. A 200-metre wave was not travelling around Greenland—or around the world—for nine days.
A Satellite Had Passed Over
The explanation could be tested against another kind of record.
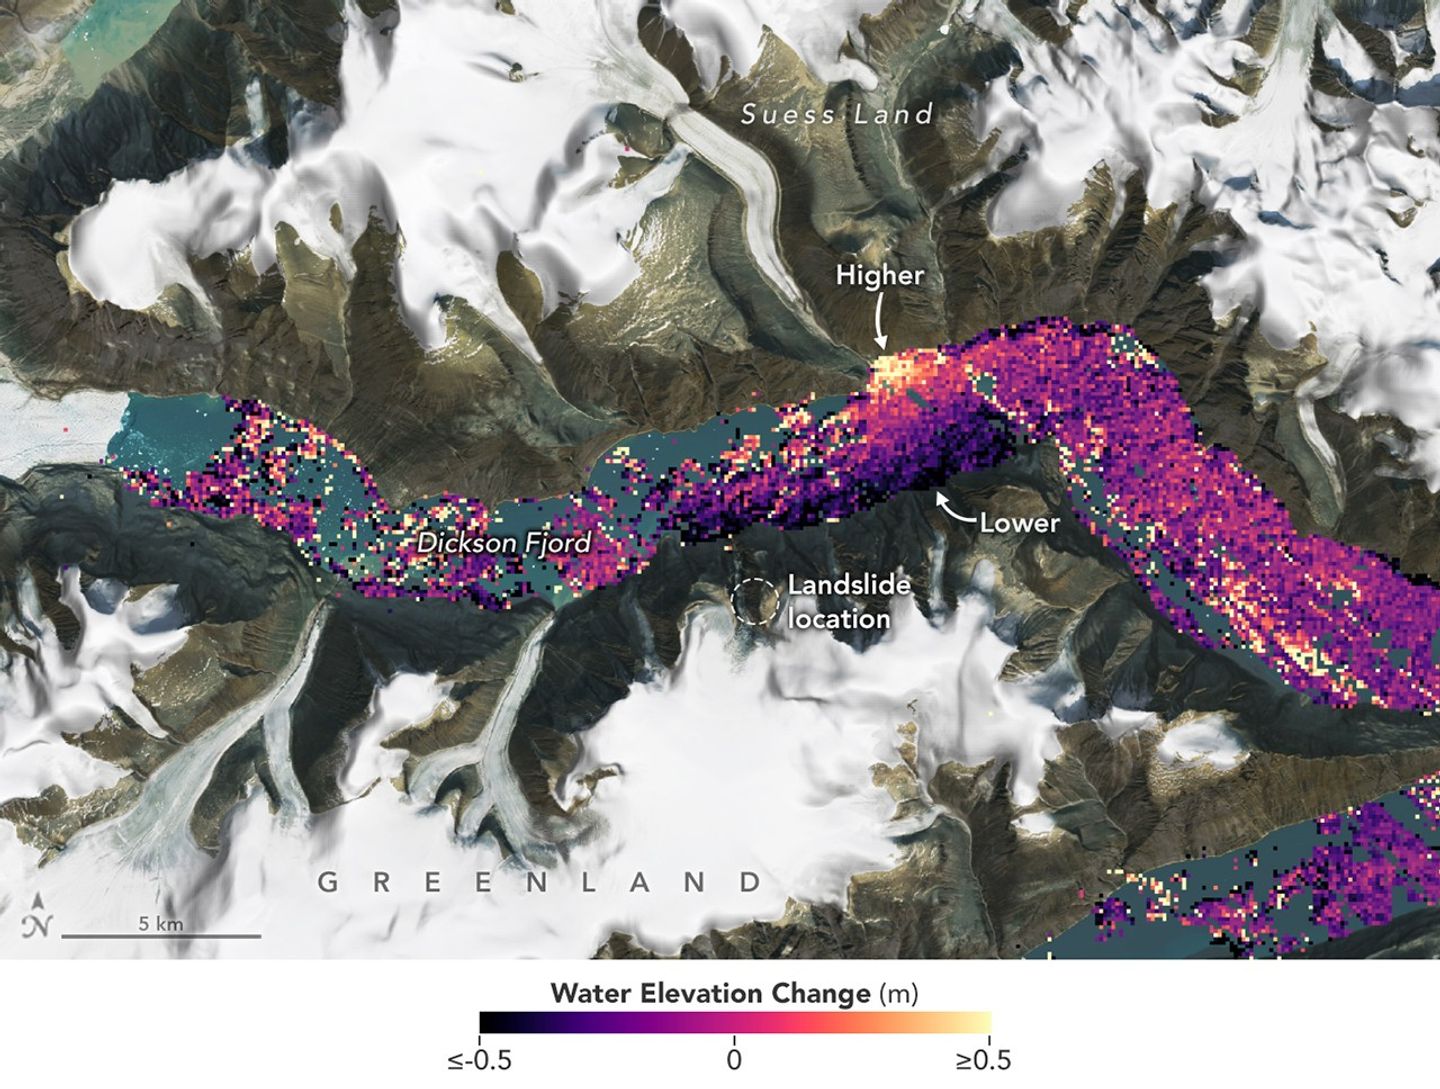
On 17 September 2023, the day after the collapse, the Surface Water and Ocean Topography satellite—SWOT—had crossed Dickson Fjord.
Its radar measured water height across a broad strip of the surface. Instead of tracing only a narrow line beneath the spacecraft, it could reveal differences between the two sides of the channel.
In the resulting visualisation, the water was tilted: higher towards one shore, lower towards the other.
The measurements had captured a shape that no photograph from a passing vessel was likely to reveal. [5]
The Signal Returns
On 11 October, a further landslide-generated tsunami produced another prolonged signal from the same fjord.
The recurrence offered a second event to examine. A study published in Nature Communications in June 2025 combined satellite observations associated with the two episodes and the seismic record.
Across separate observations, the slopes of the water surface faced opposite directions. The researchers examined winds and tides as alternative explanations. Their analysis supported water moving back and forth across the channel.
These were snapshots, separated by gaps, rather than a continuous film. Reconstructing the movement between them required the seismic measurements and further analysis.
Nevertheless, the case had changed. A mechanism first reconstructed from the landscape and the vibrations now had direct observations of the water at its centre. [2, 4]
Evidence Assessment
| Evidence | What it establishes |
|---|---|
| Seismic recordings | A persistent, unusually regular signal detected at widely separated stations. |
| Photographs and field observations | A major mountainside collapse and destructive tsunami within the Greenland fjord system. |
| The local water-level instrument | Useful observations, but its reporting interval and location limited its ability to resolve the rapid oscillation. |
| Numerical modelling | A mechanism connecting trapped, oscillating water to the signal’s period, direction and slow decay. |
| SWOT measurements | Water-surface slopes supporting the seiche explanation, interpreted alongside seismic data and checks on winds and tides. |
| The October recurrence | A second event against which the proposed explanation could be examined. |
Archive Assessment
The nine-day signal was a genuine anomaly with a well-supported natural explanation. The uncertainty concerned its source, not whether the instruments had recorded something real.
“Shook the Earth” describes its reach rather than a worldwide experience of violent shaking. Sensitive instruments detected small ground movements far from the fjord. The destruction was concentrated around the landslide and the tsunami’s path.
Some details of the reconstruction remain less certain than the central explanation. Estimates of the seiche’s initial size differ, and the satellite observations are intermittent. Those limits do not erase the agreement between the water measurements, seismic evidence and modelling.
The researchers traced the slope’s increasing vulnerability to the thinning of glacial ice that had helped support it. The sequence joined a changing mountainside to a remote inlet, and that inlet to instruments on other continents. [1–5]
What makes the case remarkable is the difference between what could be seen and what could be measured. The mountainside was visibly broken. Days later, the water gave visiting observers no obvious sign of the motion still registering far away.
A mountain had fallen. For nine days, the water kept moving.
Archive Classification
Explained
A documented seismic anomaly attributed to a landslide-generated tsunami followed by a prolonged seiche in Dickson Fjord. Seismic analysis, modelling and satellite observations provide converging support for the explanation.
Original Research · Open Access
Observations of the Seiche That Shook the World
The complete 2025 paper by Thomas Monahan, Tianning Tang, Stephen Roberts and Thomas A. A. Adcock. Its fourteen pages contain the satellite measurements, comparisons with seismic data and methods used to examine the oscillating water.
Nature Communications, volume 16, article 4777, published 3 June 2025. DOI: 10.1038/s41467-025-59851-7.
A short guide to reading the paper
Begin with the water surface. The important observation is a difference in height across the fjord. The colour maps represent measurements; they are not photographs of a wave crest.
Separate observations from reconstruction. The satellite sampled the fjord at particular times. The seismic record helps connect those snapshots, while the analysis estimates aspects of the movement that were not watched continuously.
Look for the alternative explanations. Winds and tides can also produce differences in water level. Testing those possibilities is part of the argument for identifying the slopes as a seiche.
Keep the two scales apart. The paper’s estimate of the initial seiche amplitude concerns the later oscillation. It is not the approximately 200-metre local reach of the initial tsunami.
© The Author(s), 2025. Distributed under the Creative Commons Attribution 4.0 International licence, which permits commercial reuse with attribution, a licence link and identification of changes. The linked paper is presented as the original publication; the reading guide above is separate Archive commentary. Any material carrying a separate credit or rights restriction remains subject to that notice.
Continue Through the Archive
Some unusual events leave little more than testimony. Others leave measurements so unfamiliar that understanding them becomes an investigation in itself.
Explore more cases in The Anomalous Archive →
Sources
- Kristian Svennevig and colleagues, “A rockslide-generated tsunami in a Greenland fjord rang Earth for 9 days,” Science 385, 2024, pp. 1196–1205. DOI: 10.1126/science.adm9247. Original study, including the local instrument’s sampling limitations and numerical reconstruction.
- Thomas Monahan, Tianning Tang, Stephen Roberts and Thomas A. A. Adcock, “Observations of the seiche that shook the world,” Nature Communications 16, article 4777, 3 June 2025. DOI: 10.1038/s41467-025-59851-7. CC BY 4.0; hosted PDF above.
- Geological Survey of Denmark and Greenland, “Climate-change-triggered landslide caused Earth to vibrate for 9 days,” 12 September 2024. Research-team account, field photographs and description of the investigation.
- University of Oxford, “First direct observation of the trapped waves that shook the world,” 3 June 2025. Explanation of the satellite analysis and the military vessel’s earlier visit.
- NASA Earth Observatory, “Sizing Up a Greenland Tsunami,” 12 November 2024. SWOT visualisation, acquisition dates and image credits.
- Robin George Andrews, “The Search for What Shook the Earth for Nine Days Straight,” Quanta Magazine, 12 September 2024. Original interview reporting on the early suggestions and Stephen Hicks’s humorous remark.
Further Reading
The 2024 research paper: an institution-hosted copy of the original Science study provides the earlier reconstruction. Public access to this copy is not a licence to republish it; it is linked here for consultation.
The 2025 satellite study: the complete paper hosted above develops the observational case. Reading the two studies together shows how an explanation assembled from seismic signals and modelling was subsequently tested using measurements from orbit.
Image and Document Credits
Before-and-after photographs: Søren Rysgaard and the Danish Army. Comparison supplied by the US Geological Survey’s “Greenland Glacier Before and After the September 16, 2023 Landslide” record, which labels the image public domain. Displayed at reduced size.
Satellite visualisation: NASA Earth Observatory image by Lauren Dauphin, using SWOT science-team data, Landsat data from the US Geological Survey and ArcticDEM elevation data. Published with “Sizing Up a Greenland Tsunami,” 12 November 2024. Reused editorially under NASA’s image-use guidelines. Displayed at reduced size; no endorsement is implied.
Hosted research paper: Monahan, Tang, Roberts and Adcock, 2025. © The Author(s), licensed under CC BY 4.0. Original publication: 10.1038/s41467-025-59851-7.
Editorial note: the first event occurred on 16 September 2023. The report follows the research paper’s date; the USGS image page contains inconsistent date metadata. The sea-monster remark is retained as humour from the research interview, not a scientific hypothesis.